GitHub - DeepL/usage-analytics-demo-dashboard
Usage Analytics Demo Dashboard on GitHub
/v2/admin/analytics endpoint. It provides interactive charts, flexible date ranges, and per-API-key breakdowns to help you monitor and analyze your API usage.
The dashboard is designed to be lightweight and easy to set up, with zero NPM dependencies and sample data included for testing. It can be used as-is, or as an example of how similar data can be incorporated into your own internal workflows and dashboards.
For more information about the DeepL Admin API endpoint, check out the Admin API documentation.
If you need per-request logging instead of account-wide views, see the API Usage Logger cookbook.
Features
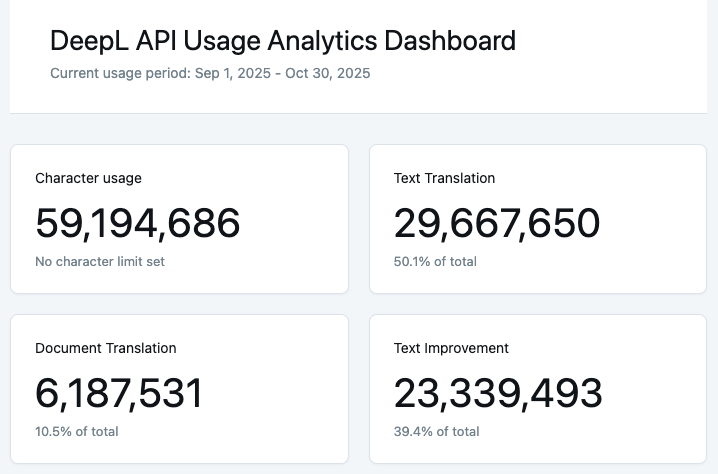
- Interactive charts and visualizations - View your usage data through multiple chart types
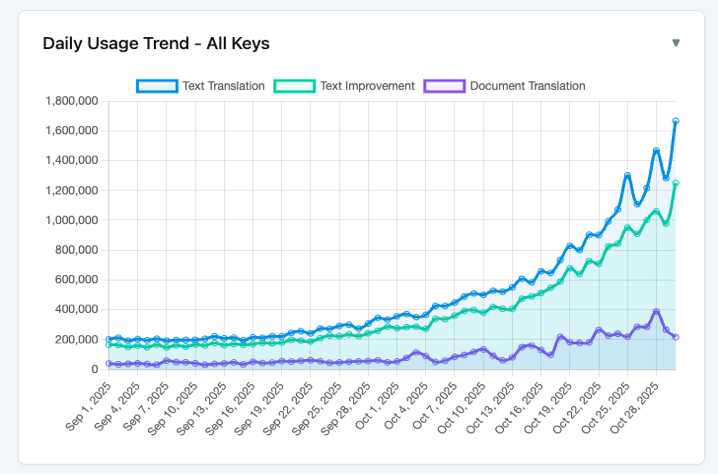
- Flexible date ranges - Analyze usage over rolling periods or fixed date ranges
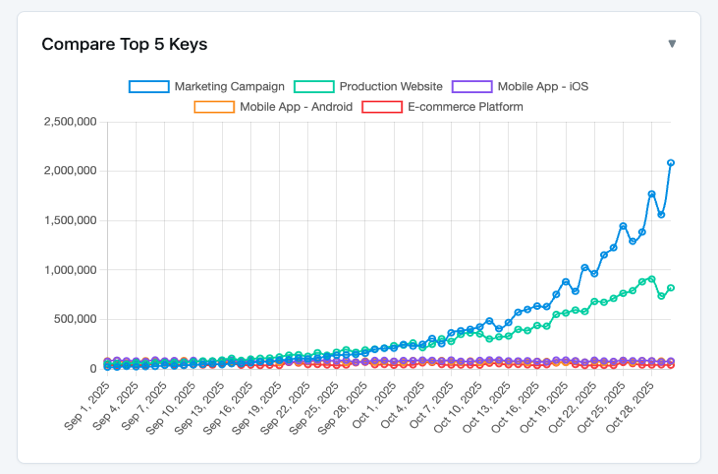
- Per-API-key breakdown - See usage broken down by individual API keys
- Basic trends and forecasting - Identify patterns in your API usage
- Secure local configuration - All configuration stays on your machine
- Zero NPM dependencies - Chart.js loaded from CDN for simplicity
- Sample data included - Test and demo without connecting to your account
Screenshots