

Consumption data in the account UI, in CSV exports, and in the Admin API analytics endpoints is available up to and including the previous UTC calendar day. For near-real-time data, use the
/usage endpoint.Choose a data source
Use the account UI for a quick check while signed in, the CSV export for detailed or offline analysis per key, per custom tag, per language pair, or per document, the
/usage endpoint for programmatic near-real-time quota checks, and the Admin API analytics endpoints for programmatic reporting and cost attribution.
API Keys and Limits tab
To check per-key consumption for the current monthly usage period, open the API Keys & Limits tab. It shows consumption for each API key in a single unit at a time — characters, speech-to-text (STT) minutes, or speech-to-speech (STS) minutes.
The API Keys & Limits tab

Switching the displayed usage unit
API Usage tab
To check your account totals, open the API Usage tab. It shows total character and STT minute usage for the current monthly usage period, and if you’re on a yearly plan, usage to date for your yearly billing period, too.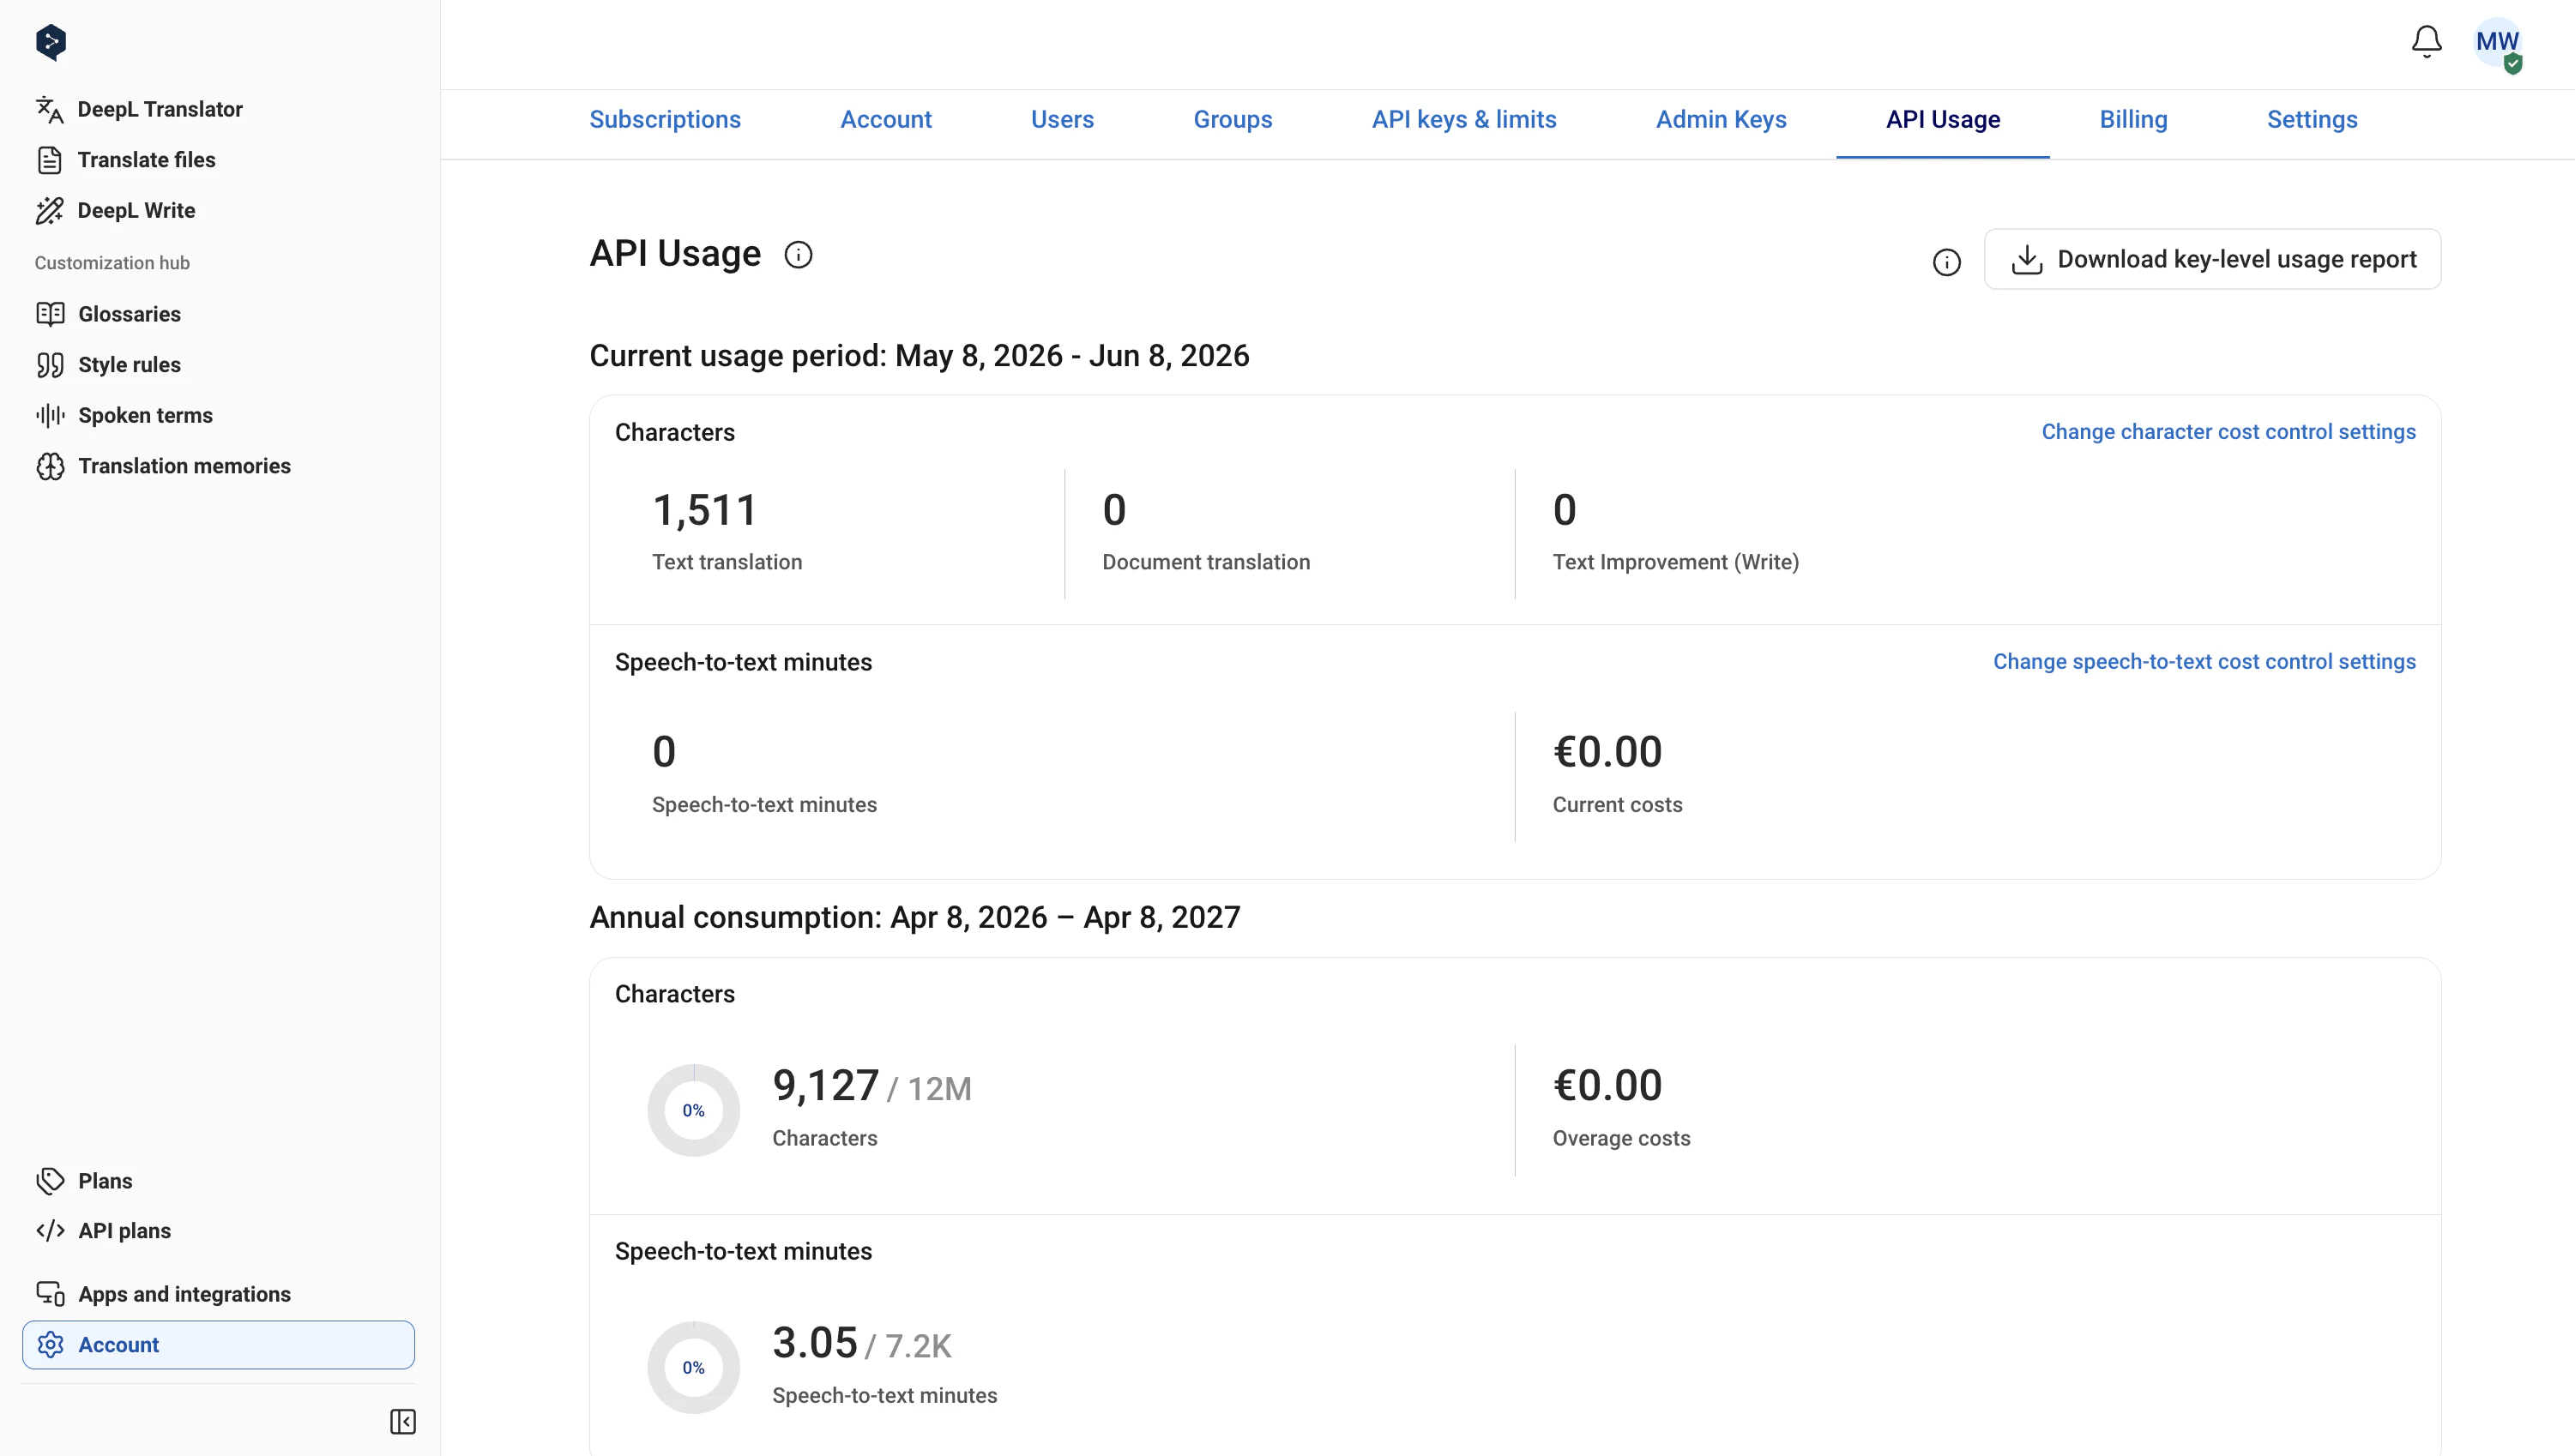
The API Usage tab
CSV export
Generate a CSV report of your usage for a chosen time period. Four report types are available:- API key-level report: characters translated per API key, including a column that breaks out text improvement (Write API) characters separately. Key-level usage is not broken out on invoices; retrieve it via CSV export, the “API Keys & Limits” tab, or the Admin API analytics endpoints.
- Custom tag-level report: characters translated per custom reporting tag. Only tagged requests appear in this report, so results reflect a subset of total usage unless every request is tagged.
- Language pair-level report: characters translated per source-target language pair. Generally available on the API Enterprise plan. On the API Pro plan, it’s available on request; contact your customer success manager to enable it.
- Document translation report: one row per translated document, with the document type, language pair, input characters, billed characters (reflecting any billing minimum applied), and whether a glossary was used. Use it to trace document translation usage back to individual documents. Generally available on the API Enterprise plan. On the API Pro plan, it’s available on request; contact your customer success manager to enable it.
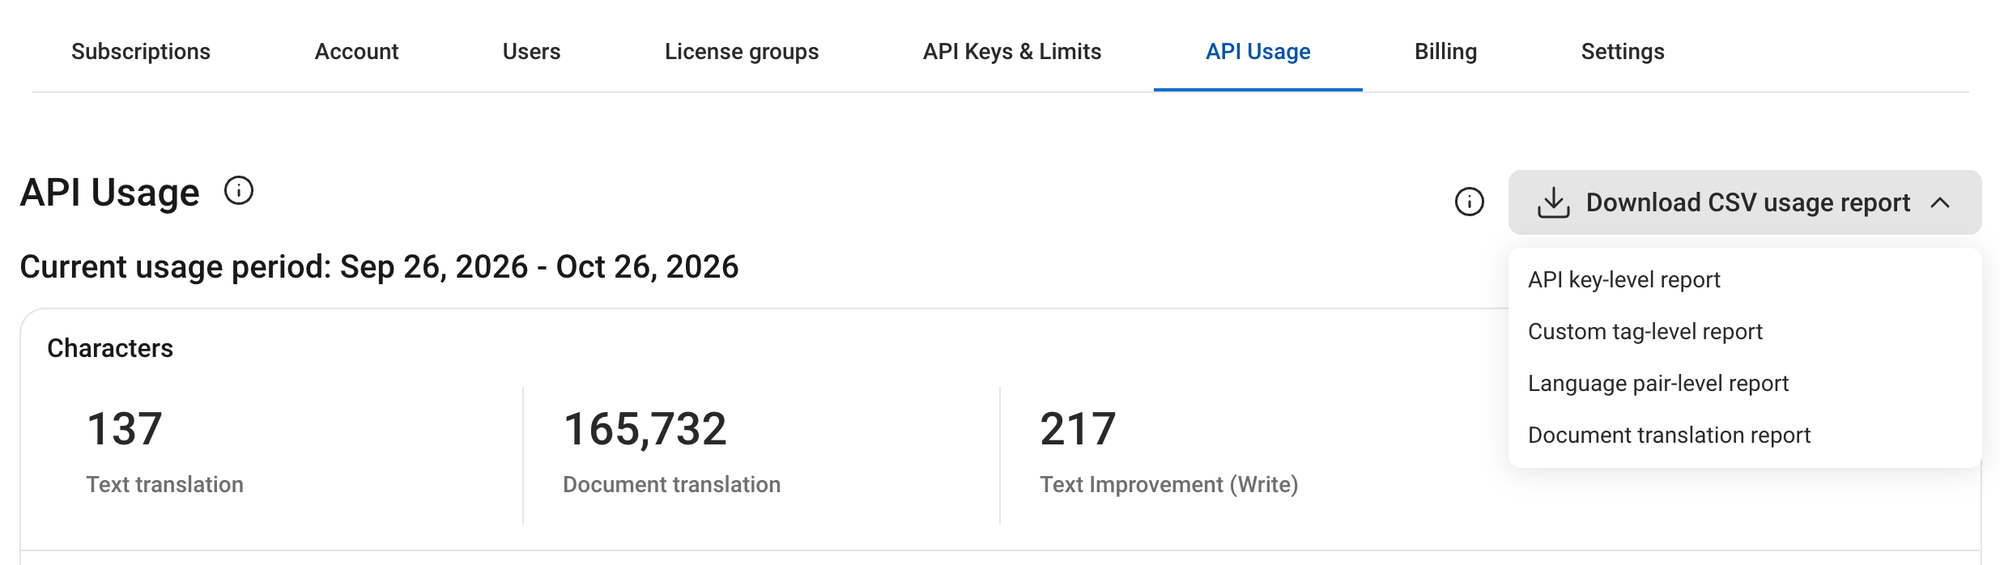
Select a report type from the "Download CSV usage report" dropdown
- Last 24 hours
- Last 7 days
- Last 30 days
- Current month
- Last month
- Current usage period
- Last usage period

Select the "Group by day" option to group usage data by UTC calendar day
Document translation data is only included in reports with a time period starting on or after May 16, 2024 00:00 UTC. Text translation data is included for all time periods.
The usage endpoint
The/usage endpoint returns a near-real-time snapshot of character and minute usage in the current monthly usage period, typically up to date within a few minutes of the usage being generated. Use it for programmatic quota checks, for example before submitting a large translation batch.
Admin API analytics
The Admin API provides programmatic access to usage data over a custom date range, with optional grouping by day. It requires an admin key for authentication. Two endpoints are available:- Get usage analytics returns usage statistics across all services (text translation, document translation, text improvement, and speech-to-text), in total or grouped by API key
- Get custom tag usage analytics returns usage broken down by custom tag
X-DeepL-Reporting-Tag header to track consumption by team, project, or any other category. Only tagged requests appear in custom-tag analytics, so results reflect a subset of total usage unless every request is tagged. See How to use custom reporting tags for setup and naming guidance. If you prefer a download over an API call, the same per-tag data is available as a custom tag-level CSV export.
For a worked example of pulling analytics data into a dashboard, see the usage analytics dashboard cookbook.